Screenshot 2025-11-12 145040.png

Our Results

Emily Booroff (head of social-climbers)

We deep dive into your message, mission and the person you are trying to reach. Then we get into the data, what is proven to work and what will make your business grow. This is coupled with an Incredible content team who are obsessed with making your page stop the scroll.

Lifestyle brand

@thefantasticfactory

Aim: The Fantastic Factory came to us to launch a whole new arm of their business. They wanted to sell their games directly to customers, especially games created for TikTok

Package: Done For You

Increase Engagement and Followers: Launch, build and scale TikTok & TikTok Shop

Three screenshots of a TikTok creator's profile, data analytics, and audience insights. The first shows the TikTok profile of 'The Fantastic Factory' with 191 followers and 290.9K likes, featuring various videos. The second displays TikTok data analysis covering a period from October 1 to October 31, 2020, indicating key metrics like revenue, orders, and product visitors. The third shows audience analytics overview with key metrics such as post views, profile views, likes, comments, shares, estimated rewards, traffic sources, and a graph of activity over 28 days.

100k Monthly TikTok Shop Revenue

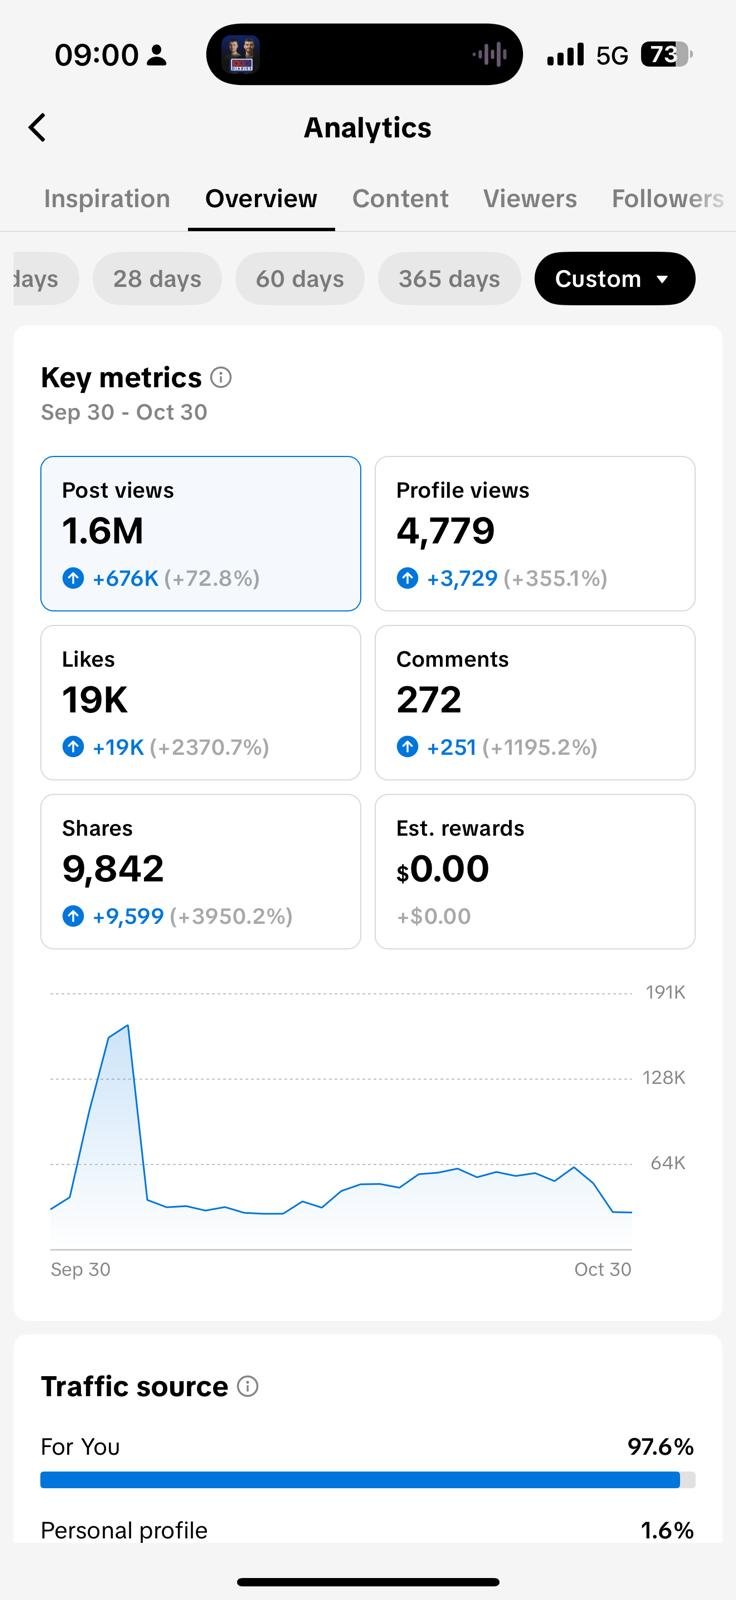
3.4 Mil+ Views monthly

100's Viral Moments

+150k Likes

We built this brand from scratch

Tiktok shop

Monthly data analysis screenshots from March to October showing metrics like GMV, SKU orders, buyers, product visitors, products sold, and percentage changes.

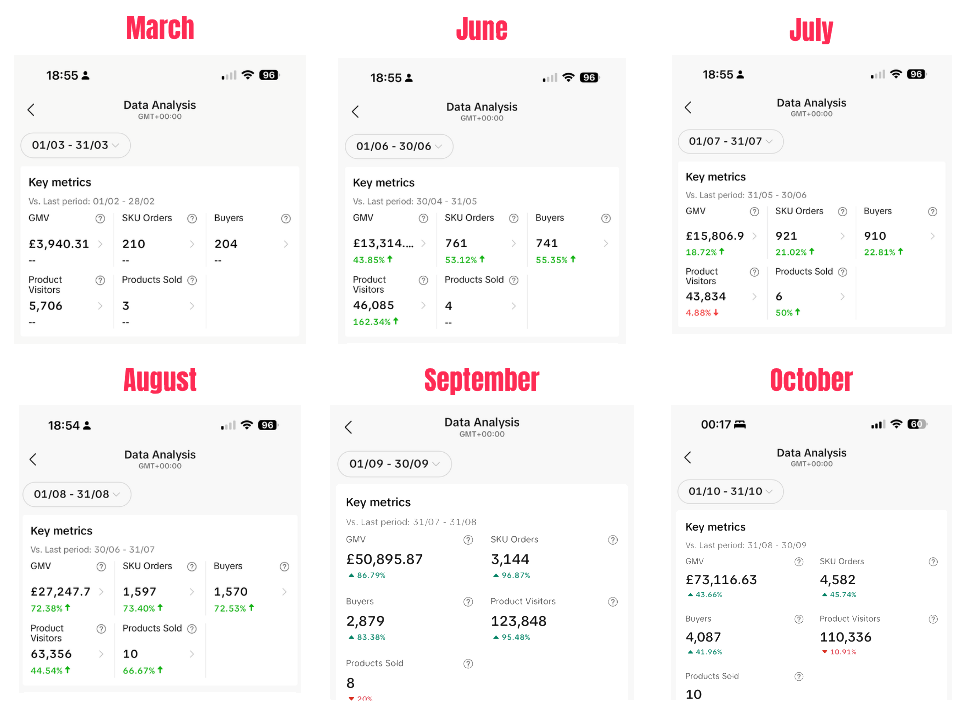
Over £150k in GMV Revenue to date, on track for £100k in November

10k+ Products Sold

20 Products Launch

8 Mil Monthly Product Views

63k Monthly Product Clicks

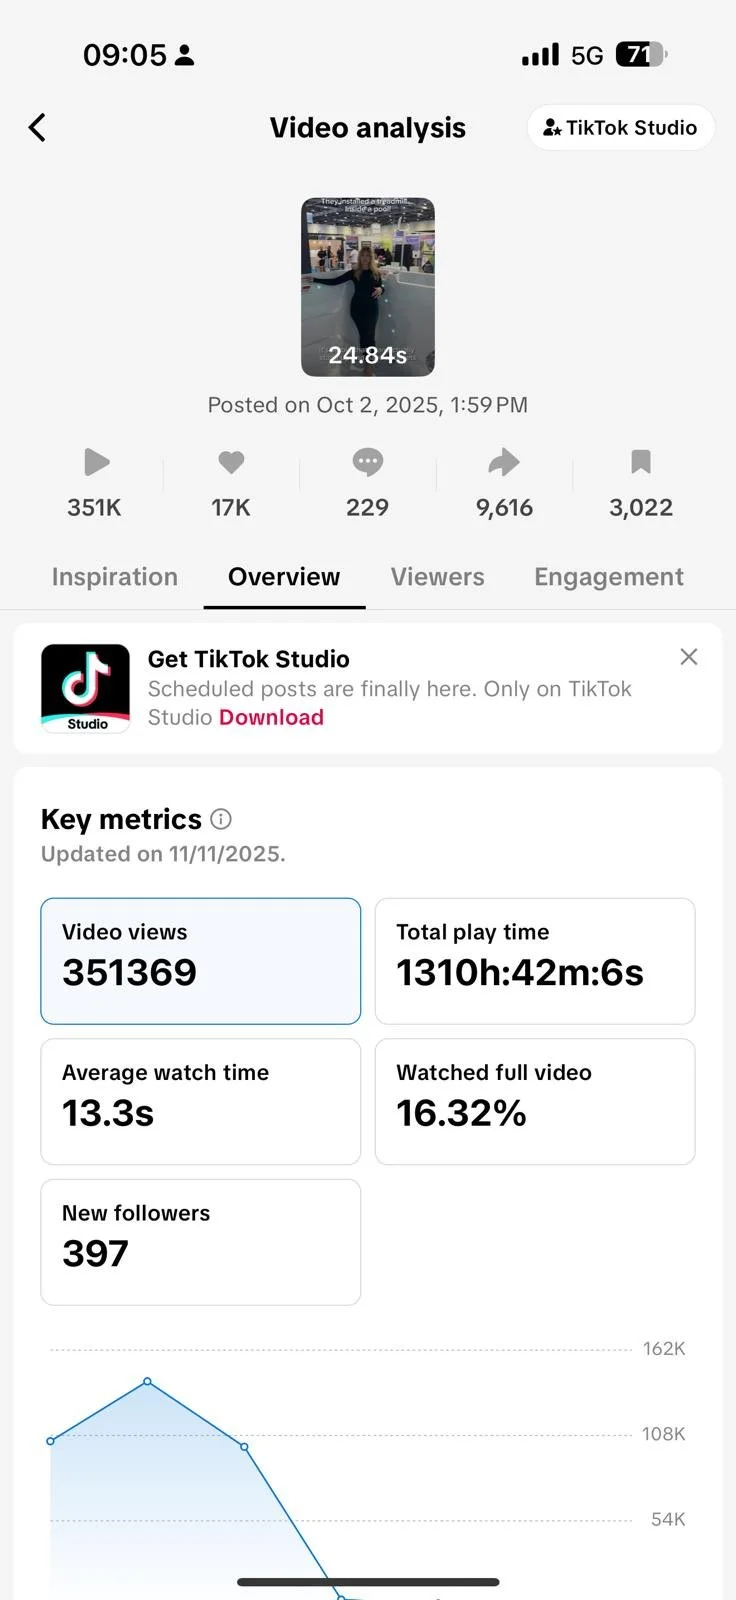
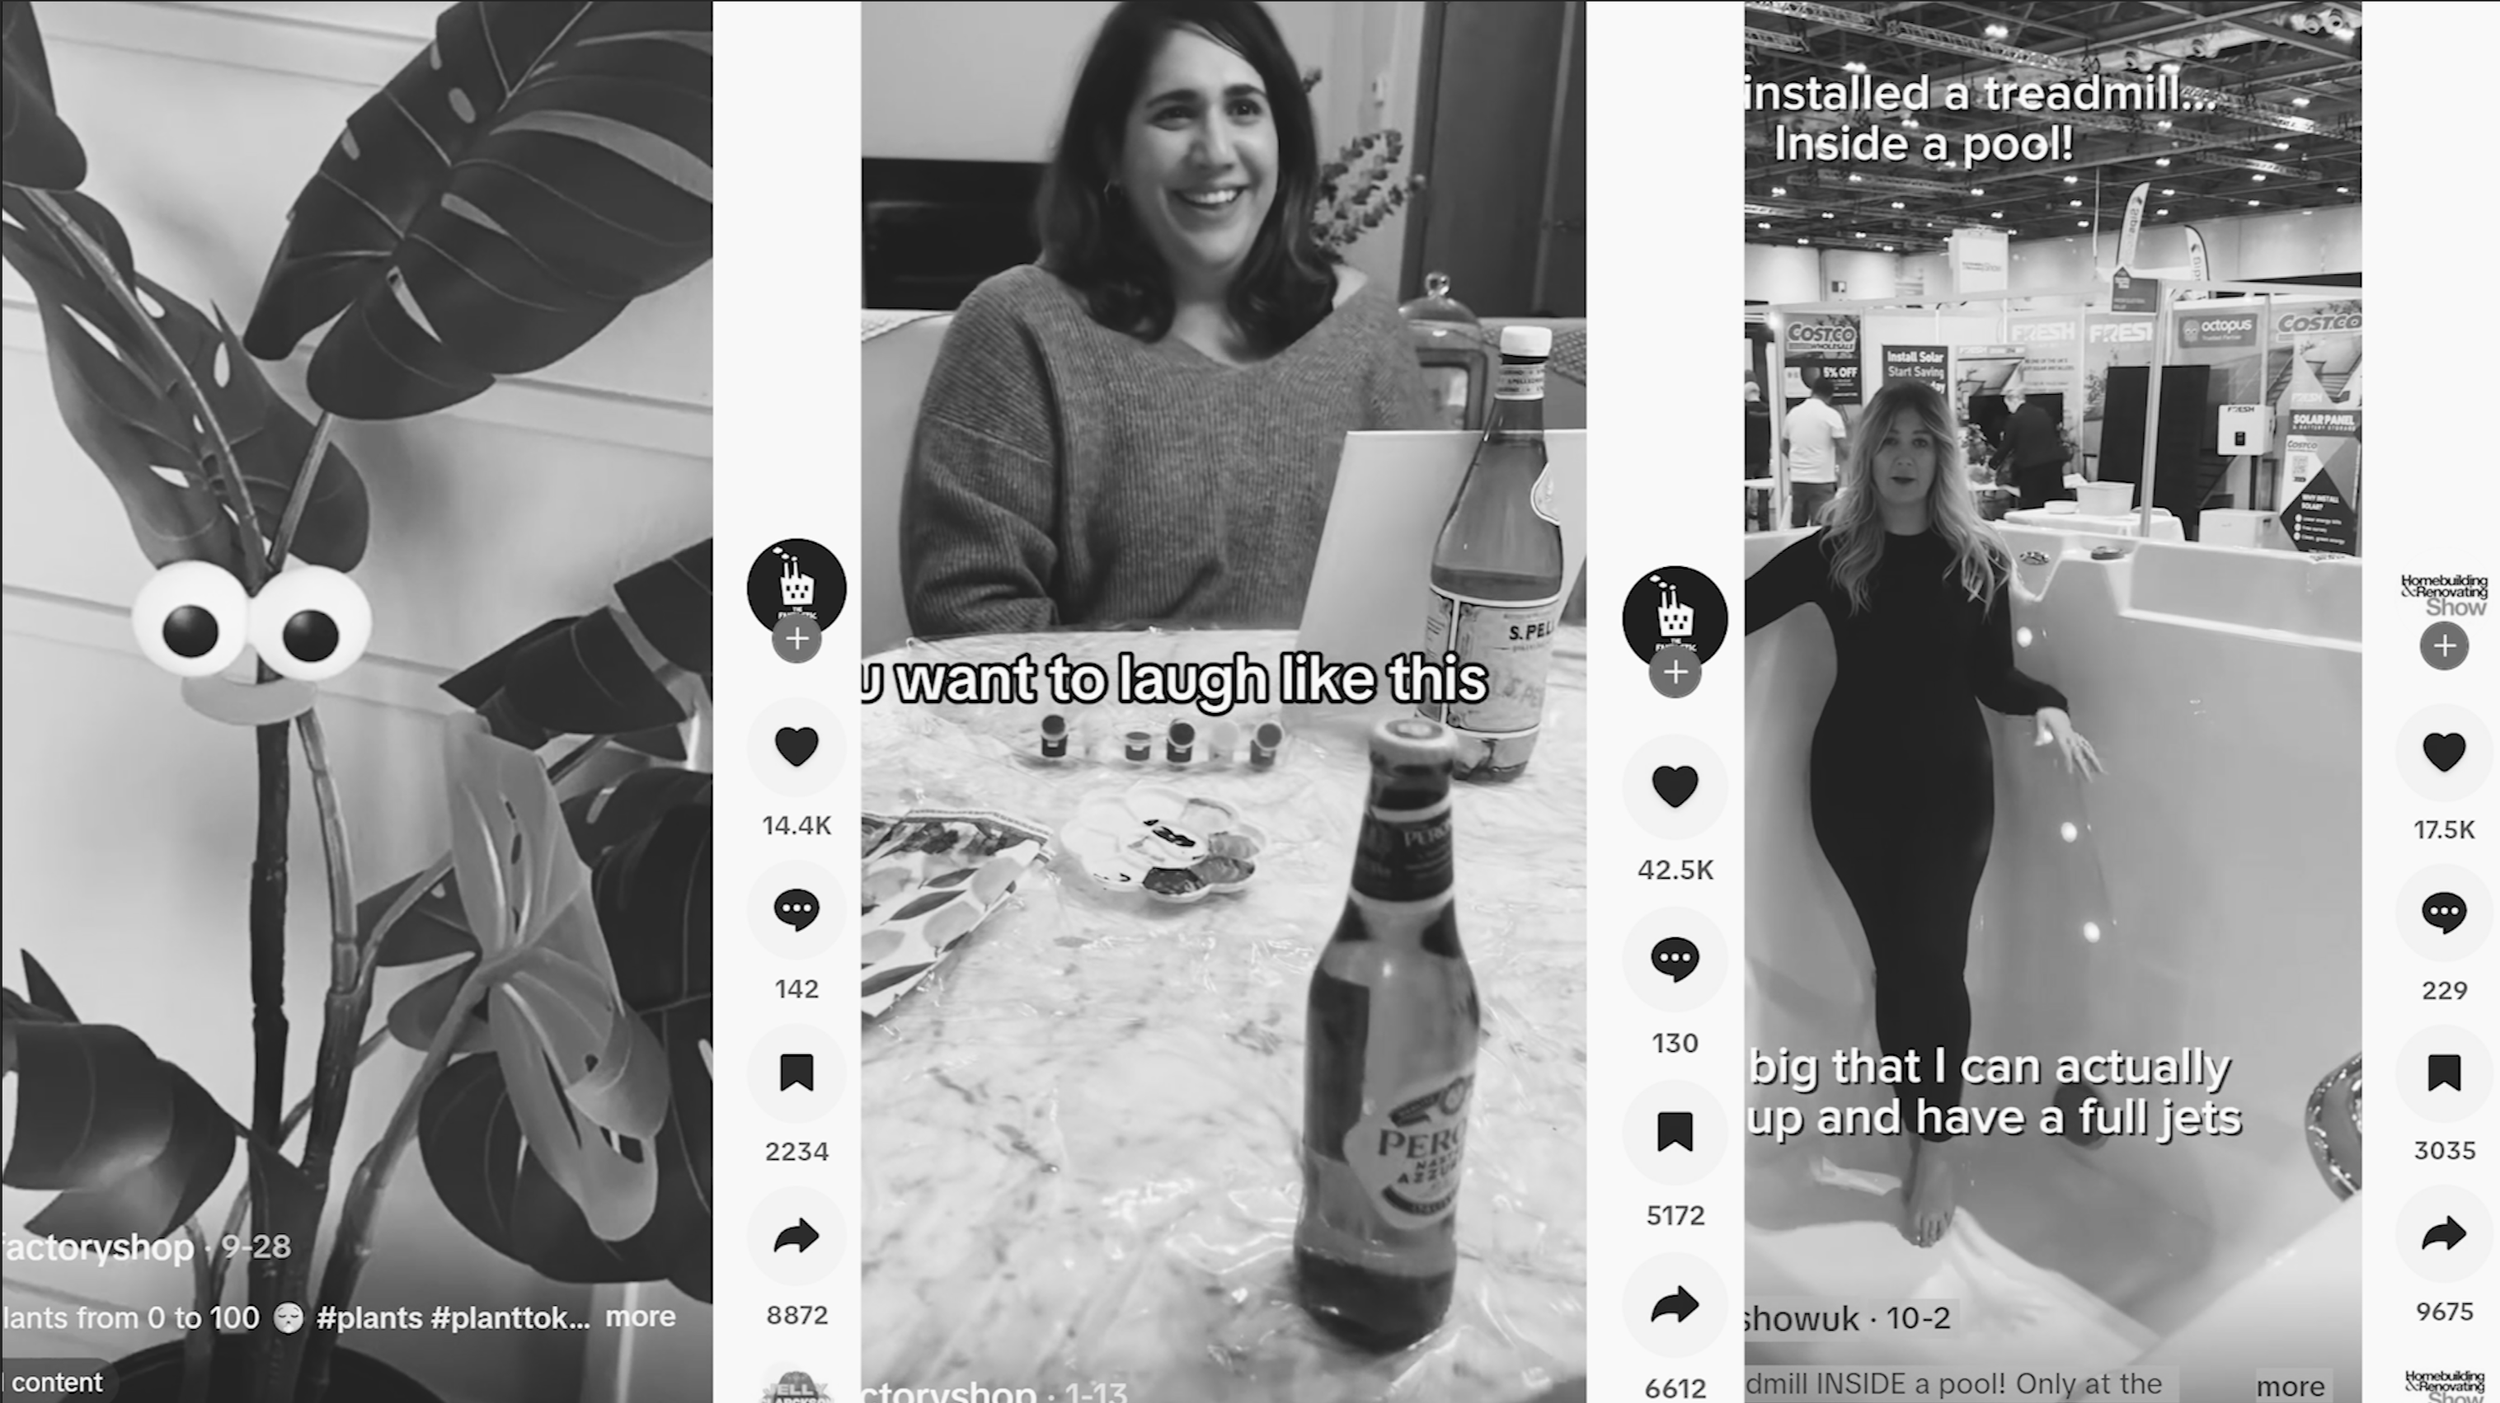
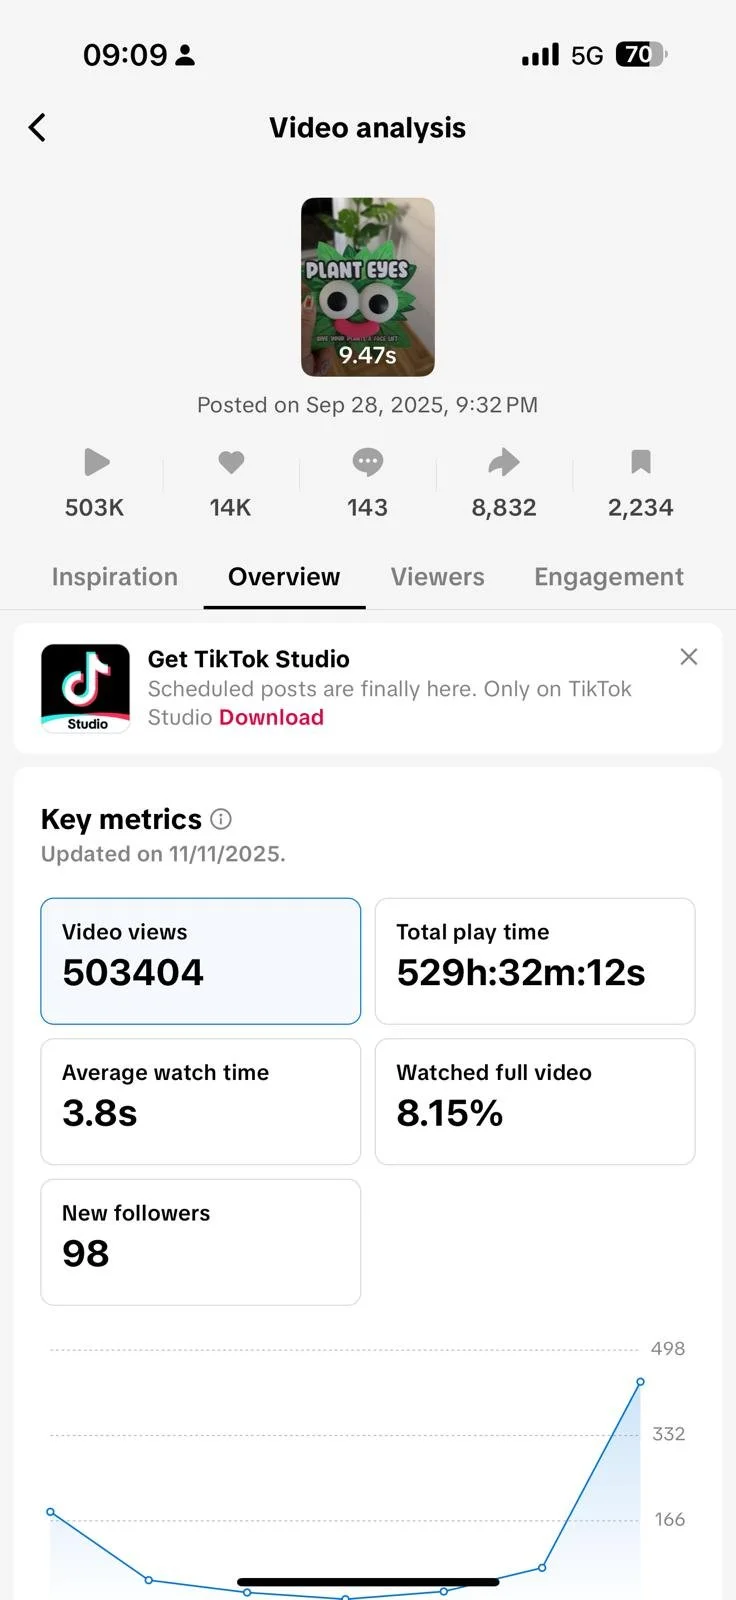
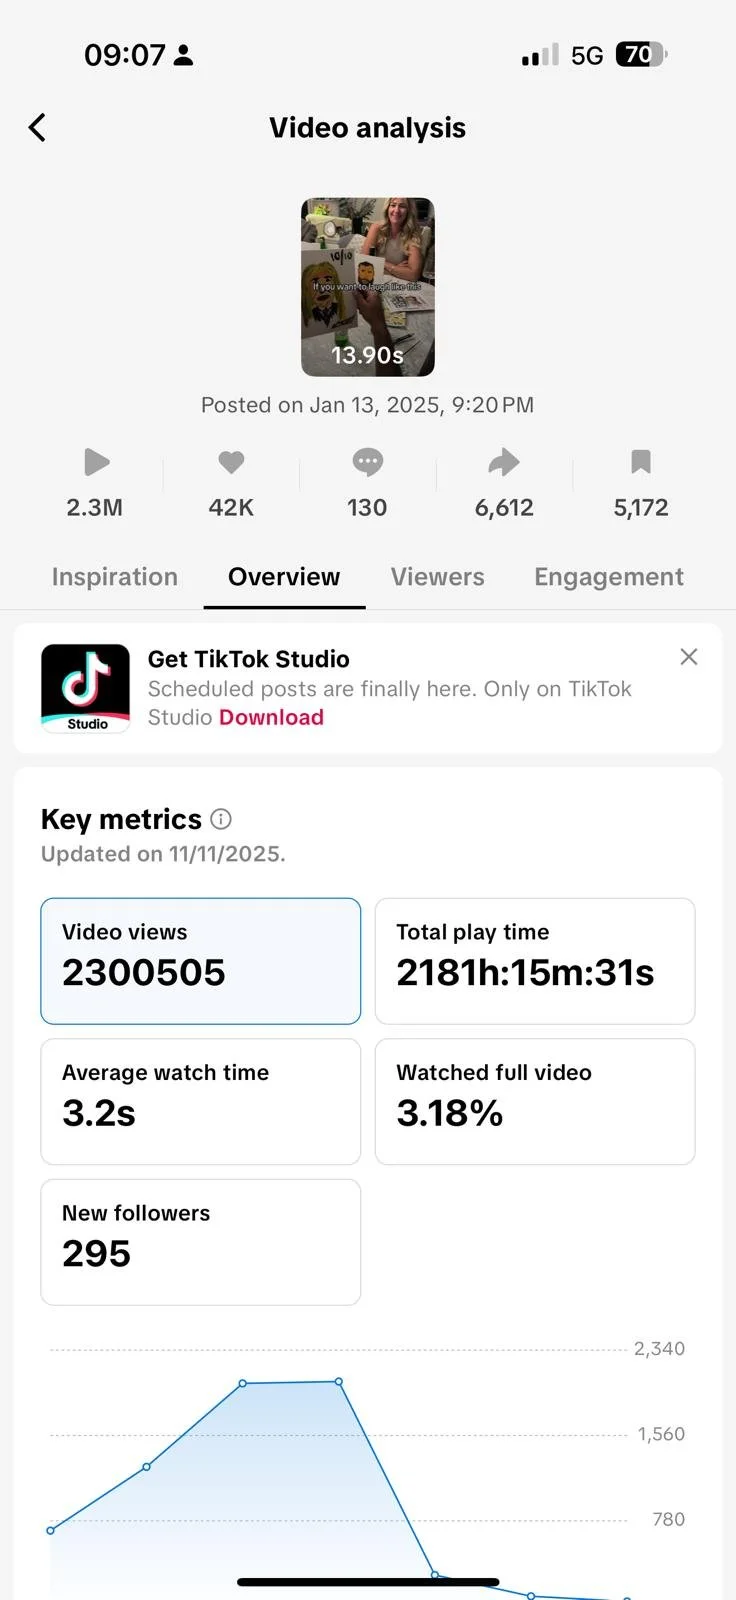
From Views like this…

A white, sketch-style arrow pointing to the upper right on a black background.
Screenshot of a social media analytics dashboard showing key metrics from November 6 to November 30, 2024, including post views, profile views, likes, comments, shares, and traffic sources.

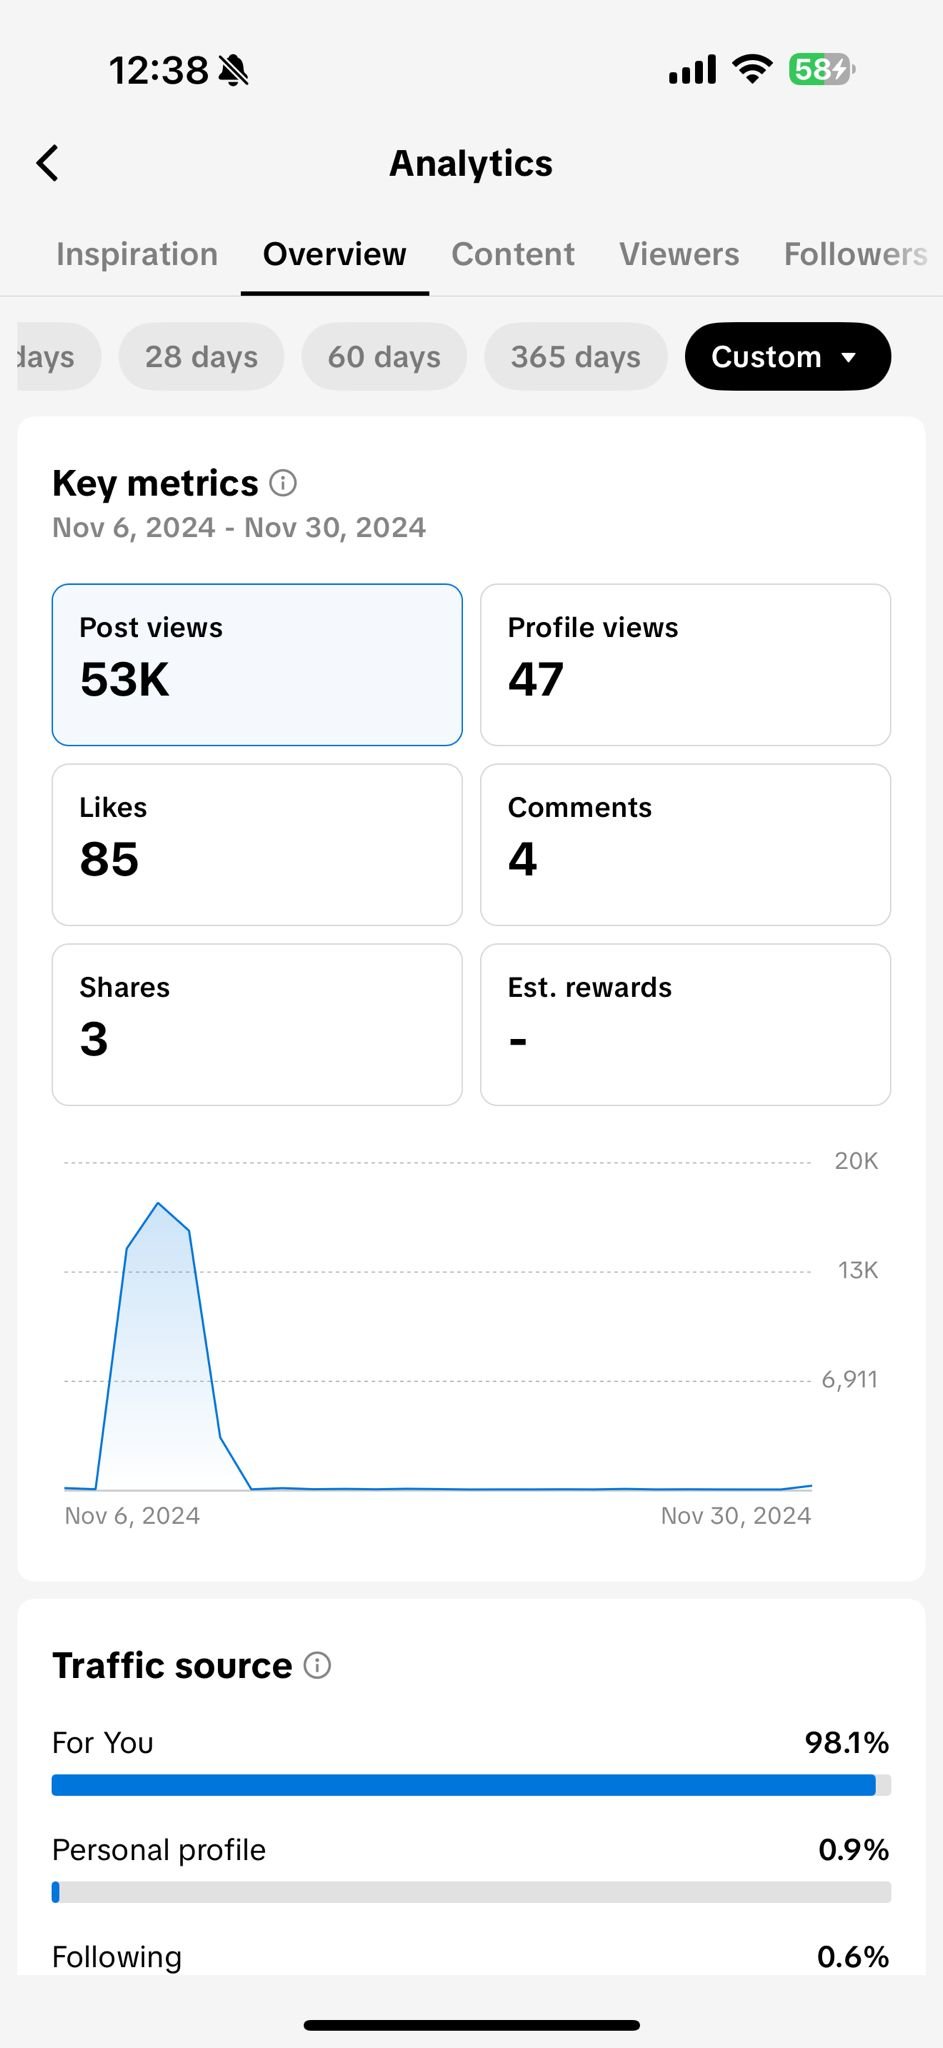
To views and engagement like this

Screenshot of social media analytics dashboard showing key metrics from September 30 to October 30. Metrics include post views, profile views, likes, comments, shares, and estimated rewards. The data shows significant growth in all areas and a graph illustrating activity trends over the month.
Line drawing of a heart with an arrow passing through it.

£100,000’s in sales

Screenshot of a TikTok video analytics page showing a thumbnail with the text 'Plant Eyes' and an animated plant with googly eyes, posted on September 28, 2025.

Millions of views

Screenshot of a TikTok video analytics dashboard showing video views, total playtime, average watch time, and other metrics, with a small video thumbnail at the top.

1000’s of shares

Screenshot of TikTok video analytics showing a woman in a dark outfit at an indoor location, with engagement metrics like video views, watch time, and new followers.